Friday, March 9, 2012

MLS wages and performance for 2011

I've had the MLS on my mind as of recently with the 2012 season kicking off tomorrow. Inspired by Simon Kuper and Stefan Szymanski's work on evaluating the best managers in English football, I've put together a simple analysis that attempts to answer the question: which are the best run clubs in the MLS? The idea behind Kuper and Szymanski's analysis is that a team's wage bill explains much of the variation in a team's performance. Thus, managers whose teams consistently perform better than would be predicted by wages are effective managers.

Their analysis is much more thorough than the analysis below, and they focused on managers in the English game. This analysis is focused more on clubs than managers (or coaches), since most MLS coaches have limited control over which players are on their roster. The complex salary cap rules also make interpretation of the MLS data difficult. The figure below displays the cost (in wages) for every 3 points earned in the league. Since a club earns 3 points for each win, it is more simply thought of as the cost per win (or alternatively 3 draws). Clubs that over-perform (i.e., have a low wage bill and perform well) have a low cost per win, while clubs that under-perform (i.e., have a high wage and perform poorly) have a high cost per win. In other words, a shorter bar in the figure below indicates better performance given the level of wages.
Data on points earned are from the MLS, and data on wages are from the MLS Players Union. I use 2011 guaranteed compensation to calculate each club’s wage bill. The wage column in the above figure is in millions of dollars.
As can be seen in the above figure, Seattle has the lowest cost per 3 points earned, as each win cost the Sounders only $161,911 in wages. This suggests that Seattle is an effectively managed club in terms of player personnel decisions (e.g., signing bargain players who are undervalued) and/or tactics and strategy (i.e., getting the most out of the players available). On the other hand, the New York Red Bulls have the highest cost per win, $871,810 in wages, which is over 5 times more costly than Seattle.

It's important not to make too much of the above data. The LA Galaxy had a fantastic season in 2011, and yet, judging by the above metric, they performed poorly. I would argue that the law of diminishing returns applies to soccer in the same way that it applies to most firms. In the context of soccer, at a certain point, each additional good player added to a roster yields a lower return than the player before. For instance, if a soccer club has no good strikers, it probably would reap substantial rewards by signing a top striker. The return on signing a second top striker is also likely quite high (though possibly lower than the first). But, the return on signing a third striker would almost certainly be lower than the second (though it still might be considerable), and signing a fourth striker would likely yield an even lower return than the third. In other words, at some point, the return from each additional dollar spent on the club is lower than the last. So, once the club is past this point, the cost of earning an additional point (our measure of production) increases; this is known as increasing marginal cost.

One method to account for diminishing returns is to use a logarithmic functional form. I replicate my analysis from above, but instead of calculating wages per 3 points earned, I use the natural log of wages, ln(wages), per 3 points earned. Interpreting the actual values for log wages per win is not very intuitive, so I present the rankings using each of the two methods in the table to the left.

Even after taking into account diminishing returns with log wages, Seattle remains atop the rankings. Amazingly, the LA Galaxy jumped 15 spots from 17th based on wages to 2nd based on log wages. New York improved in the rankings, but the Red Bulls only jumped to 12th. Aside from LA and New York, no other team improved more than 2 places. Portland experienced the largest drop in the rankings falling from 4th to 11th, while New England fell 4 places and Chicago and Vancouver each fell 3 places.

Sunday, March 4, 2012

Manchester United vs. Tottenham Hotspur, second half

Tottenham dominated most of the first half, and they continued to control the game in the opening period of the second half. Unfortunately for Spurs, Ashley Young scored goals in the 60th and 69th minutes against the run of play to give Manchester United a 3-0 lead. Young's first goal was a difficult volley into the far, lower corner. For his second goal, he received the ball from Evra with plenty of time to turn, took two touches, and then beautifully curled the ball into the far, upper corner of the goal. As nice a finish as the second goal was, Younès Kaboul stepped back rather than closing down Young, leaving Young a massive amount of space. Both goals were well taken, but very much against the run of play. The passing visualization below shows each team's passing in their attacking third from half time through the 69th minute (when Young scored United's third goal). Tottenham clearly continued to dominate in that opening period of the second half even as Manchester United scored their second and third goals.

ATTACKING THIRD PASSING: HALF TIME TO MINUTE 69

After the third goal, United were content to pass the ball around their defensive third and the middle third of the field, and Tottenham--deflated from conceding 3 goals during a long spell in which they dominated--were content to let United pass the ball around. Jermaine Defoe scored a consolation goal in the 87th minute after a United defensive lapse, but it was of little consolation to Tottenham supporters. As the passing visualization below shows, United completed 148 total passes to Tottenham's 80 passes from the 70th minute (just after United's third goal) through the final whistle.

TOTAL PASSING: MINUTE 70 TO FULL TIME

In the end, much like Arsenal vs. Liverpool, the team that took their chances secured 3 points, while the team that dominated the run of play left the match with nothing. The visualization below shows that United scored 3 goals from their 6 attempts, while Spurs managed only 1 goal from their 18 attempts.

SCORING ATTEMPTS: WHOLE MATCH

Manchester United vs. Tottenham Hotspur, first half

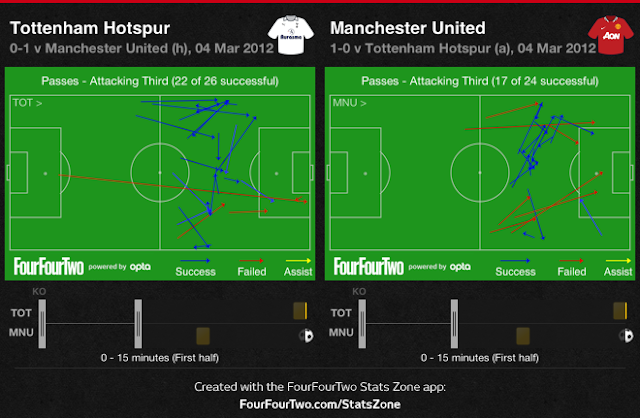
Manchester United lead 1-0 on a Wayne Rooney goal headed from a corner just before the end of the half. Tottenham fans undoubtedly think that United are undeserving of a lead, especially after Adebayor's goal was called back for a hand ball. It was a very difficult decision for Martin Atkinson, as the ball clearly hit off Adebayor's arm (after deflecting off his stomach), but there didn't appear to be intent nor an advantage gained (the ball would have fell to Adebayor even if it hadn't hit his arm). Even so, Tottenham were the better side in the first half, as the figures below of passing in the attacking third indicate. The first 15 minutes of the half were relatively even, but Spurs dominated the remaining two-thirds of the first half.

ATTACKING THIRD PASSING: MINUTE 0 TO MINUTE 15

ATTACKING THIRD PASSING: MINUTE 16 TO HALF TIME

Thursday, March 1, 2012

Michael Cox looks at relationship between EPL goals per game and performance of English clubs in UCL

We finished our last blog post mentioning Michael Cox's proposed relationship between goals per game over the course of a Premier League season and the performance of Premier League teams in that season's Champions League competition. In his article for the Guardian on Monday, Cox provided anecdotal evidence that as goals per game in the Premier League increases from season to season, the performance of Premier League teams in the Champions League falls during that time. It turns out Cox took a closer look at the data and published his findings on his Zonal Marking blog the following day. Plotting 3 year goals per game averages against a 3 year average Champions League performance metric, Cox finds that there does appear to be a relationship. You can read his post and look at his graphs here.

Defending a lost art in England? Comparing GPG in Premier League with European domestic leagues

Yesterday Michael Cox's article in the Guardian described the tactics of top Premier League clubs this season as "anarchic." He suggested that when England's top 5 sides have competed against one another this season, none have employed defensive, reactive tactics even after taking leads in these games. Rather, they have opted to push numbers forward freely, creating remarkably open games with defenses left vulnerable at the back. As a result, these games have been high scoring, often with the team that scores first failing to take control and kill off the game despite having a lead.

Cox contrasts these run-and-gun tactics of the top Premier League teams with those of Spain, Italy, and Germany. He suggests that in Spain there is a well-established hierarchy and teams desperately try to avoid open games against Barcelona and Real Madrid. As a result, opponents of the two Spanish giants are forced to react to the technical superiority of their opponents, play more defensively and keep the space Barca and Madrid are allowed to play in compact. In Italy, the tempo of games is much slower with teams patiently trying to break one another down. In Germany, games between top sides are cautious, tactical, and involve a lot of counterattacking.


The more cautious, tactically-minded approach of top Spanish, Italian, and German sides would seem to indicate that games played between the best teams in each of La Liga, Serie A, and the Bundesliga would produce on average fewer total goals than games played between the Premier League's top teams where games are very open. For the sake of this posting, we have arbitrarily defined "top teams" as those that currently sit in first through fifth place in their respective domestic league. Indeed, the top left graph above shows that games between the top 5 English clubs have produced an astonishing average of 4.86 goals per game. Games between the top 5 Spanish clubs have produced an average of 3.92 goals per game; games between the top 5 Italian clubs have produced an average of 2.33 goals per game; and games between the top 5 German clubs have produced just 1.93 goals per game. The data suggest the less tactics-conscious approach of top EPL teams results in more goals in matches contested between those teams.

The graphs above also provide statistics for the average number of goals conceded by the winning team per game and average goals scored by the winning team per game in matches between top 5 clubs in the four domestic leagues we've looked at. These statistics give us an idea of how cautious and defensive each league's approach to games are. In leagues that are more cautious and defensive, we'd expect the winning team to both score fewer goals and concede fewer goals to their opponent since teams in these leagues will be hesitant to push men forward and leave themselves exposed at the back. Games that ended in draws were not included in these statistics.

Incredibly, in the 11 games played between top 5 Bundesliga teams that have produced a winner (3 ended in ties), the winning team has conceded only once for an average of 0.09 goals conceded by the winning team. However, the winning team has scored only 1.82 goals per game. This is in stark contrast to the Premier League where the winning team concedes on average 1.25 goals per game and scores 3.75 goals on average. In Italy the winning team concedes only 0.43 goals per game on average and scores 2 goals on average. In Spain the winning team concedes 0.78 goals per game and scores 3.33. The data suggest games between top German sides are the most tactically defensive and those between top English sides are the least tactically cautious.

Cox ends his article pointing to evidence that English teams' refusal be submissive and focus on defending has contributed to their poor form in the Champions League. Manchester City and Manchester United failed to advance to the knockout stages. Arsenal trail AC Milan 4-0 after the first leg of the round of 16 and stand virtually no chance of advancing. Chelsea trail Napoli 3-1 going into the second leg and also face an uphill battle to advance. Cox notes:
When the Premier League enjoyed its best run in Europe, between 2004-2005 and 2008-2009, the goals per game average in the Premier League was down at around 2.5. In the previous five seasons, when England had no European Cup finalists, it was over 2.65. Since 2005, it has risen to 2.8.