"Napoli don't particularly care if the opposition dominate possession. The issue is to hold them at arm's length, prevent easy chances and then strike on the break. That's why Napoli's record is comparatively so much better against the top sides than the bottom: in a mini league of the top seven teams in Serie A they would be second, precisely because they want their opponent to take the initiative."
And that, of course, is dreadful news for Chelsea ahead of the second leg. This Napoli are by no means impregnable. They are susceptible at set-plays and even with three centre-backs they looked far from comfortable against a fairly muted Didier Drogba. The deployment of Juan Mata centrally disrupted them, his movement twice in the first half creating channels that first Ramires and then Branislav Ivanovic nearly exploited with runs from deep.
But this Napoli are devastating on the counterattack. In the second half last night, as Ivanovic advanced, pushing Juan Zúñiga, the left-back, deep, contributing to a spell of pressure in which Chelsea had five decent chances in the space of around 15 minutes, Ezequiel Lavezzi sat in the space behind him and waited for the counter. He wasted his first chance, dragging his shot wide, but after Edinson Cavani had capitalised on a David Luiz slip, he added the third goal, Ivanovic unable to get back.
That's the problem Chelsea face at Stamford Bridge in the return leg. They must take the initiative, but they must do so against a team that wants them to do exactly that."

Wednesday, February 22, 2012
Jonathan Wilson on Napoli v. Chelsea and the resurgence of a back 3
The following is an excerpt from Jonathan Wilson's latest blog post for the Guardian. He discusses the resurgence of a back 3 in Italian football looking specifically at how, playing with a back 3, Napoli were able to exploit Chelsea on the break in their 3-1 win in the first leg of the Champions League round of 16. With Chelsea forced to score 2 goals to have a chance of advancing in the second leg at Stamford Bridge, they'll have to aggressively push men into the attack, creating dangerous space for Napoli to exploit on the counter.
Monday, February 20, 2012
Links, 2/20/12 edition
On Arsenal and Arsène Wenger:
- Jonathan Wilson: "Wenger and Arsenal's decline due to idealism or fundamentalism?"
- Michael Cox: "Arsenal's flaws exposed as Sunderland stump opposition with hybrid approach"
- Matt Scott: "Arsène Wenger has only £55 million to spend this summer to strengthen Arsenal's underperforming squad"
On Chelsea and André Villas-Boas:
- Gabriele Marcotti: "Collapse of a Coaching Wunderkind"
- Sam Wallace: "Villas-Boas is so right to put the boot into dressing room"
- Dominic Fifield: "Roman Abramovich is backing my Chelsea project, says André Villas-Boas"
Other news:
- Tim Nash: "Mick McCarthy’s sacking can be traced back to the summer transfer window as the owner’s faith began to waver"
- Andy Hunter: "Liverpool and Luis Suárez 'critically undermined' anti-racism efforts"
- Part 2 of an interview with David Sullivan, joint-chairman of West Ham United, on Scott Parker, Matthew Upson, and Ravel Morrison
- Part 6 of an interview with David Sullivan, joint-chairman of West Ham United, on the club's financial state
Sunday, February 19, 2012
Links, 2/19/12 edition
- John Carlin: "The tragedy of Fernando Torres"
- Brad Plumer: "How soccer brings Wall Street to a grinding halt"
- Part I of an interview with David Sullivan, joint-chairman of West Ham United, on relegation, Avram Grant, and Demba Ba
- Alex Duff and Lucia Baldomir: "FIFA Probes $56 Million Uruguay Trades for Soccer Stars Who Don’t Show Up"
- "TTFF claims Jack Warner controlled account holding missing Haiti funds"
Friday, February 17, 2012
U.S. Soccer Interview with Jurgen Klinsmann: Tactical Formations
Klinsmann discusses how he doesn't have a preferred formation but rather bases tactical decisions on available personnel and the opponent.
Wednesday, February 15, 2012
Link to interesting sports economics blog... and its relevance to soccer
Freakonomics Blog: Ball hogs and long meetings
Although this post in the Freakonomics Blog by Dave Berri focuses on “ball hogs” in professional basketball, I thought its message that we often place too much emphasis on scoring when evaluating athletes was relevant in soccer as well. Berri argues that in the NBA we tend to look too much at scoring without focusing on the number of shots it takes a player to score those points. When an NBA “ball hog” takes a shot he is also taking one away from his teammates. If his teammates were more likely to make their shot than the ball hog is to make his, then the ball hog's shot actually hurts the team. Berri looks specifically at New York Knicks player Carmelo Anthony who has consistently led his teams in scoring in his career but only twice has been in the top 5 on his team in “true field goal percentage” (a parameter that measures shooting efficiency in three pointers, field goals, and free throws). With Anthony in the lineup this season the Knicks are 10-12, without him they have not lost.
Although this post in the Freakonomics Blog by Dave Berri focuses on “ball hogs” in professional basketball, I thought its message that we often place too much emphasis on scoring when evaluating athletes was relevant in soccer as well. Berri argues that in the NBA we tend to look too much at scoring without focusing on the number of shots it takes a player to score those points. When an NBA “ball hog” takes a shot he is also taking one away from his teammates. If his teammates were more likely to make their shot than the ball hog is to make his, then the ball hog's shot actually hurts the team. Berri looks specifically at New York Knicks player Carmelo Anthony who has consistently led his teams in scoring in his career but only twice has been in the top 5 on his team in “true field goal percentage” (a parameter that measures shooting efficiency in three pointers, field goals, and free throws). With Anthony in the lineup this season the Knicks are 10-12, without him they have not lost.
What does this have to do with soccer? Chelsea’s Daniel Sturridge immediately came to mind when I read this article. Sturridge is tied with Frank Lampard as Chelsea’s leading scorer with 9 league goals. But throughout the season his tendency to take on defenders and shoot, often from ridiculous angles, rather than finding teammates in better positions to score has crushed a number of Chelsea goal-scoring chances. Like the Anthony NBA example, Sturridge’s shots often mean taking a better opportunity to score away from a teammate. Perhaps a future post from Soccermetrica will look at the shooting percentages (an individual player’s goals scored divided by his total shots taken) of the Premier League’s top scorers. It’s important to note that this statistic is not a perfect one in judging a player’s efficiency in front of goal however. Midfielders and defenders may tend to take their shots further from goal on average than a forward. We’d expect this variable to result in lower shooting percentages for midfielders and defenders. Shooting percentage fails to capture where shots were taken on the pitch. However, it also seems likely that midfielders and defenders are more selective about the shots they take since their performance isn’t judged on goals to the extent a forwards is. Based on this variable, we’d expect midfielders and defenders to actually have higher shooting percentages. It’s difficult to judge which of these variables would dominate without looking at the data.
Monday, February 13, 2012
Brief thoughts on Liverpool FC's reaction to Suárez
A lot has been written on the Luis Suárez controversy, so I don't think there is much to add to the conversation. Even so, I'm going to go ahead and do so. I have heard some analysts and commentators ask whether Kenny Dalglish has done harm to his legacy by returning to Liverpool and leading them to mediocrity. I don't think that he has harmed his legacy as a result of the club's underwhelming performance, but he has done severe, perhaps irreperable, harm to his reputation through his unequivocal, visceral support of Suárez. Fans of the Premier League have expressed shock that Suárez refused Patrice Evra's hand. I am not in the slightest. Dalglish and LFC had the gall to declare that Suárez was in fact the victim of slander perpetrated by an agent of their chief rival, Manchester United. Dalglish and LFC continued propagating this characterization even after the FA released a report documenting that Suárez admitted to calling Evra "negro." Why should Suárez not act like the victim if his club and manager have told him and declared to the rest of the world that he is? It's appalling to me that it has taken Fenway Sports Group this long to react to behavior that has been, without argument, incredibly damaging to LFC's reputation and, thus, the club's brand. The decision makers at Liverpool seemed to have made the poorest of judgments. Suárez is a football player; he is a good one, but nevertheless, he is still only a football player. And, no single player is bigger than his club, especially a club as steeped in tradition and pride as Liverpool Football Club. Shame on Kenny Dalglish, shame on Fenway Sports Group, and shame on Liverpool Football Club.
Sunday, February 12, 2012
Links, 2/12/12 edition
- Leigh Montville's 1993 article in Sports Illustrated on the tragic plane crash that killed almost the entire Zambian national team
- Jonathan Wilson on Zambia's remarkable victory to win the Africa Cup of Nations
- Michael Cox of Zonal Marking breaks down the tactics from the Zambia-Côte d'Ivoire Cup of Nations final
- Simon Kuper on racism in English football as well as elsewhere in Europe
Saturday, February 11, 2012
The difficulty of succeeding as an international manager
In many ways, managing a national side seems like an ideal job. International managers have very few day-to-day responsibilities besides, well, watching a lot of soccer. Of course these managers every so often have to choose a squad for a friendly or a qualifying match for a major tournament (e.g., the World Cup, Euros) and then coach the squad in these matches. But on the whole, international managers have far fewer daily responsibilities than club managers. Sounds like a pretty cushy job, right?
In fact, it's far from ideal. The much-maligned Fabio Capello, who recently stepped down as England manager, in fact had the best record of any England manager in recent history.1 Despite that England won two-thirds of their games under Capello, FA councillor Peter Coates recently declared that Capello should not have stayed on as manager after the World Cup: "We had a terrible World Cup, he was responsible for that and he should have gone then." Coates is hardly in the minority; many other English fans and journalists have expressed a similar sentiment. International managers are not judged on their overall record. Instead, they are judged based on their team's performance in knockout style tournaments that don't occur all that often.2 Most of the better national teams (that regularly qualify for the big tournaments) compete in a regional tournament every four years and the World Cup every four years. So, these teams compete in a major tournament every other year. Their performance in these tournaments is essentially the sole criterion used to evaluate the success of an international manager.
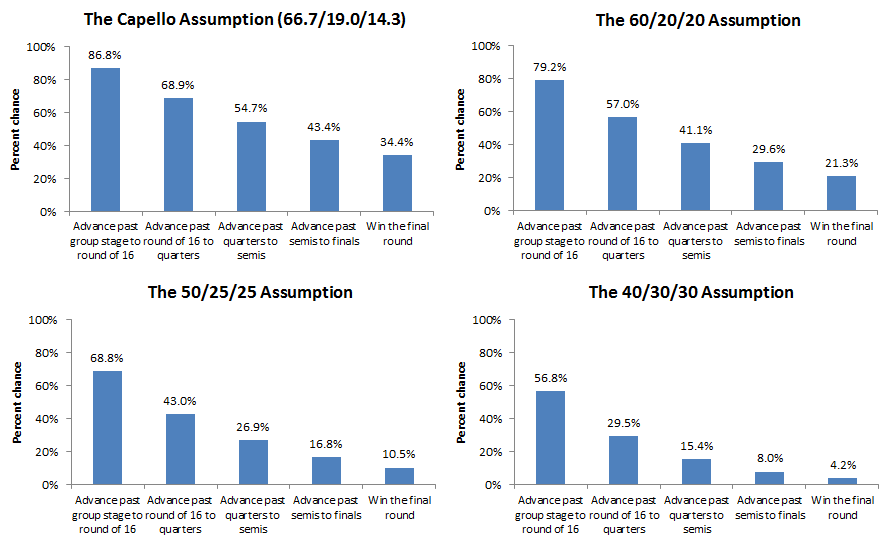
Using simple probability theory, it quickly becomes clear why it's so difficult to succeed in international management, especially under circumstances in which supporters expect their team to win trophies. Capello had the best record of an England manager in recent history winning 66.7 percent of games, losing 19.0 percent of games, and drawing 14.3 percent of games. This is certainly a remarkable record in international football. Let's assume, for the sake of simplicity, that Capello's record with England represents England's true (constant) probability of winning, losing, and drawing games in a major tournament. Such an assumption is, in fact, almost certainly a huge overstatement since these tournaments are by their nature "the finals." The level of competition is, on average, much higher than general competition since teams in these tournaments had to prevail in an often arduous qualification process in order to participate in the tournament.
Since games in the knockout phase of the tournament cannot end in a draw, I further assume that England wins 67.7 percent of the games that are tied at the end of regulation. This assumption equates to a 79.4 percent chance of winning games in the knockout phase of the tournament, since these games cannot end in a draw.3 In this informative albeit terribly simplistic model, England have an 87 percent chance of advancing past the group stage,4 a 69 percent chance of advancing past the first knockout round (the round of 16 in the World Cup and the quarterfinals of Euros), a 55 percent chance of advancing past the second knockout round (the quarterfinals of the World Cup or the semifinals of Euros), a 38 percent chance of advancing past the third knockout round (the semifinals of the Cup or winning Euros), and a 29 percent chance of winning the fourth knockout round or the final match of the World Cup (see the figure below entitled, "The Capello Assumption..."). In other words, even imposing incredibly unrealistic assumptions--e.g., that England have nearly an 80 percent chance of winning games in the knockout rounds of the World Cup or Euros against the likes of Spain, Brazil (not Euros obviously), Germany, France, Portugal, Argentina (again, not Euros obviously), etc.--England would have less than a one-in-three chance of winning the World Cup (and less than a two-in-five chance of winning Euros). Yet, England fans expect trophies! That is not to say that England haven't underperformed, as they most likely have, but an expectation that a manager should bring home a trophy from a knockout tournament is unrealistic.

Now, let's analyzes a team's chances of advancing through a 32-team tournament with, perhaps, more reasonable probabilities of winning (no need to pick on England any further). The figures above display these probabilities for a team with a 60/20/20 percent chance of winning, losing, and drawing, a 50/25/25 percent chance of winning, losing, and drawing, and a 40/30/30 percent chance of winning, losing, and drawing.5 As these figures indicate, the likelihood that the 60/20/20 team, which has a 72 percent chance of winning games in the knockout round, wins the tournament is 21 percent. In other words, we would expect this very strong team to win a World Cup about every 20 years.6 The 50/25/25 team, which is also a quite strong team with a 62.5 percent chance of winning games in the knockout round, has a 10.5 percent chance of winning the tournament (which equates to winning a World Cup about every 40 years). And finally, the 40/30/30 team, which is still a very decent team with a 52.5 percent chance of winning games in the knockout phase, has less than a 5 percent chance of winning the tournament (which equates to winning a World Cup about every 96 years).
1. To be clear, Capello resigned after the English FA intervened and took away the captain's armband from alleged racial-abuser John Terry. Even so, some in the Italian media have asserted that Capello was "escaping" England.
2. The World Cup and most of the regional tournaments (e.g., the UEFA European Championship) are structured as a group stage followed by a knockout stage. Four teams are assigned to each group; all of the teams within a group play each other; and the teams with most points (3 points per win and 1 point per draw) advance to the single-elimination, knockout phase of the tournament.
3. I arrive at 79.4 percent by assuming that England have a 66.7 percent chance of winning a game that is a draw at the end of regulation: 0.667+0.190*0.667=0.794 or 79.4 percent.
4. I assume that teams with 5 or more points always advance out of the group stage, teams with 4 points have a 50 percent chance of advancing out of the group stage, and teams with 3 or fewer point points never advance past the group stage. In the past 4 World Cups, 11 out of 23 teams that ended the group stage with 4 points advanced to the knockout phase.
5. I again use the same methods as in note 2 to assume that the 60/20/20 team has a 72 percent chance of winning games in the knockout rounds (0.60+0.20*0.60=0.720), the 50/25/25 team has a 62.5 percent chance of winning games in the knockout rounds (0.50+0.25*0.50=0.625), and the 40/30/30 team has a 52.5 percent chance of winning games in the knockout rounds (0.40+0.30*0.40=0.525).
6. For the estimates of how often a team is expected to win the World Cup, I round to the nearest multiple of 4, since the World Cup is held every 4 years.
In fact, it's far from ideal. The much-maligned Fabio Capello, who recently stepped down as England manager, in fact had the best record of any England manager in recent history.1 Despite that England won two-thirds of their games under Capello, FA councillor Peter Coates recently declared that Capello should not have stayed on as manager after the World Cup: "We had a terrible World Cup, he was responsible for that and he should have gone then." Coates is hardly in the minority; many other English fans and journalists have expressed a similar sentiment. International managers are not judged on their overall record. Instead, they are judged based on their team's performance in knockout style tournaments that don't occur all that often.2 Most of the better national teams (that regularly qualify for the big tournaments) compete in a regional tournament every four years and the World Cup every four years. So, these teams compete in a major tournament every other year. Their performance in these tournaments is essentially the sole criterion used to evaluate the success of an international manager.
Using simple probability theory, it quickly becomes clear why it's so difficult to succeed in international management, especially under circumstances in which supporters expect their team to win trophies. Capello had the best record of an England manager in recent history winning 66.7 percent of games, losing 19.0 percent of games, and drawing 14.3 percent of games. This is certainly a remarkable record in international football. Let's assume, for the sake of simplicity, that Capello's record with England represents England's true (constant) probability of winning, losing, and drawing games in a major tournament. Such an assumption is, in fact, almost certainly a huge overstatement since these tournaments are by their nature "the finals." The level of competition is, on average, much higher than general competition since teams in these tournaments had to prevail in an often arduous qualification process in order to participate in the tournament.
Since games in the knockout phase of the tournament cannot end in a draw, I further assume that England wins 67.7 percent of the games that are tied at the end of regulation. This assumption equates to a 79.4 percent chance of winning games in the knockout phase of the tournament, since these games cannot end in a draw.3 In this informative albeit terribly simplistic model, England have an 87 percent chance of advancing past the group stage,4 a 69 percent chance of advancing past the first knockout round (the round of 16 in the World Cup and the quarterfinals of Euros), a 55 percent chance of advancing past the second knockout round (the quarterfinals of the World Cup or the semifinals of Euros), a 38 percent chance of advancing past the third knockout round (the semifinals of the Cup or winning Euros), and a 29 percent chance of winning the fourth knockout round or the final match of the World Cup (see the figure below entitled, "The Capello Assumption..."). In other words, even imposing incredibly unrealistic assumptions--e.g., that England have nearly an 80 percent chance of winning games in the knockout rounds of the World Cup or Euros against the likes of Spain, Brazil (not Euros obviously), Germany, France, Portugal, Argentina (again, not Euros obviously), etc.--England would have less than a one-in-three chance of winning the World Cup (and less than a two-in-five chance of winning Euros). Yet, England fans expect trophies! That is not to say that England haven't underperformed, as they most likely have, but an expectation that a manager should bring home a trophy from a knockout tournament is unrealistic.
(Click on figures to enlarge)
Now, let's analyzes a team's chances of advancing through a 32-team tournament with, perhaps, more reasonable probabilities of winning (no need to pick on England any further). The figures above display these probabilities for a team with a 60/20/20 percent chance of winning, losing, and drawing, a 50/25/25 percent chance of winning, losing, and drawing, and a 40/30/30 percent chance of winning, losing, and drawing.5 As these figures indicate, the likelihood that the 60/20/20 team, which has a 72 percent chance of winning games in the knockout round, wins the tournament is 21 percent. In other words, we would expect this very strong team to win a World Cup about every 20 years.6 The 50/25/25 team, which is also a quite strong team with a 62.5 percent chance of winning games in the knockout round, has a 10.5 percent chance of winning the tournament (which equates to winning a World Cup about every 40 years). And finally, the 40/30/30 team, which is still a very decent team with a 52.5 percent chance of winning games in the knockout phase, has less than a 5 percent chance of winning the tournament (which equates to winning a World Cup about every 96 years).
1. To be clear, Capello resigned after the English FA intervened and took away the captain's armband from alleged racial-abuser John Terry. Even so, some in the Italian media have asserted that Capello was "escaping" England.
2. The World Cup and most of the regional tournaments (e.g., the UEFA European Championship) are structured as a group stage followed by a knockout stage. Four teams are assigned to each group; all of the teams within a group play each other; and the teams with most points (3 points per win and 1 point per draw) advance to the single-elimination, knockout phase of the tournament.
3. I arrive at 79.4 percent by assuming that England have a 66.7 percent chance of winning a game that is a draw at the end of regulation: 0.667+0.190*0.667=0.794 or 79.4 percent.
4. I assume that teams with 5 or more points always advance out of the group stage, teams with 4 points have a 50 percent chance of advancing out of the group stage, and teams with 3 or fewer point points never advance past the group stage. In the past 4 World Cups, 11 out of 23 teams that ended the group stage with 4 points advanced to the knockout phase.
5. I again use the same methods as in note 2 to assume that the 60/20/20 team has a 72 percent chance of winning games in the knockout rounds (0.60+0.20*0.60=0.720), the 50/25/25 team has a 62.5 percent chance of winning games in the knockout rounds (0.50+0.25*0.50=0.625), and the 40/30/30 team has a 52.5 percent chance of winning games in the knockout rounds (0.40+0.30*0.40=0.525).
6. For the estimates of how often a team is expected to win the World Cup, I round to the nearest multiple of 4, since the World Cup is held every 4 years.
Tuesday, February 7, 2012
More on net passing
Last week I discussed how we should interpret the net passing statistic and whether it's related to a team's performance. In that post, I analyzed the points per game earned by each of the big six clubs within various levels of net passing. Points per game is an important performance metric, as points ultimately determine each team's place in the table. In addition to points per game, another useful performance metric is goal difference. One advantage of goal difference is that it is more fine-grained than points per game. Whether a team wins 1-0 or 7-0 they still earn three points. Goal difference, however, allows for variation within wins and losses. The continuous nature of goal difference also lends itself to statistical analysis.
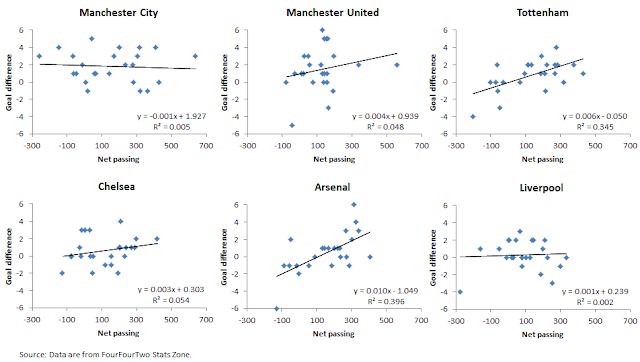
The figures below plot net passing against goal difference for each of the members of the big six (the bivariate regression is estimated using OLS). For clubs that rely on passing and possession to build goals, we would expect a positive relationship between net passing and goal difference. In other words, we would expect that as a team completes more and more passes than an opponent, the team's goal difference increases. For teams that rely more on a counter-attacking style of play, we would not expect a discernible relationship between net passing and goal difference.
The figures below plot net passing against goal difference for each of the members of the big six (the bivariate regression is estimated using OLS). For clubs that rely on passing and possession to build goals, we would expect a positive relationship between net passing and goal difference. In other words, we would expect that as a team completes more and more passes than an opponent, the team's goal difference increases. For teams that rely more on a counter-attacking style of play, we would not expect a discernible relationship between net passing and goal difference.

(Click to enlarge)
For Manchester City and Liverpool, net passing explains less than 1 percent of the variation in goal difference (R2=0.005 and R2=0.002, respectively). Net passing explains about 5 percent of the variation in goal difference for Manchester United and Chelsea (R2=0.048 and R2=0.054, respectively). For the North London clubs, however, net passing explains considerably more of the variation in goal difference. Remarkably, about 35 percent of the variation in Tottenham's goal difference is explained by net passing (R2=0.345), and nearly 40 percent of the variation in Arsenal's goal difference is explained by net passing (R2=0.396). Not surprisingly, the coefficient on net passing is statistically significant only in the Arsenal and Tottenham models (p<0.01). For Arsenal, each additional 100 passes completed more than the opposing team is associated with nearly a 1 goal increase in goal difference. An increase of the same size in net passing for Tottenham is associated with a 0.6 goal increase in goal difference.
In sum, there is a strong relationship between net passing and goal difference for Arsenal and Tottenham, a weak relationship for Manchester United and Chelsea, and no apparent relationship for Manchester City and Liverpool.
In sum, there is a strong relationship between net passing and goal difference for Arsenal and Tottenham, a weak relationship for Manchester United and Chelsea, and no apparent relationship for Manchester City and Liverpool.
Saturday, February 4, 2012
Stats show Chelsea a better team playing AVB's high line
From the outset of the 2011-2012 Barclays Premier League season first-year Chelsea manager Andre Villas-Boas tried to install a new tactical system at Stamford Bridge focused on a high defensive line and pressing high up the field when out of possession. The purpose of this system is to shorten the field decreasing the amount of open space the opposition has to play in and the amount of time they have on the ball. The desired outcome is to win the ball back quickly and dominate possession throughout the 90 minutes. The danger with playing such a high line is that balls played over the top of the defensive four can lead to one-on-ones with the goalkeeper, particularly when a team’s center backs are lacking for pace. Indeed Chelsea’s center backs struggled to cope with balls in behind them early in the season compiling just one clean sheet in their first 10 league matches and conceding 5 goals to Arsenal and 3 goals to Manchester United. The high defensive line drew criticism from pundits and Chelsea fans alike. In their final Champions League group stage game against Valencia, a must win for the Blues, AVB opted for the first time to play a deeper line and try to catch the Spanish side on the counter. Chelsea won that game 3-0 and looked more convincing than they had all season. Since then Chelsea have continued to play a deeper line.

We are interested in exploring how this change in tactics has impacted Chelsea’s overall performance, both defensively and offensively and, most importantly, their results. We compare Chelsea’s results when they play a high line (games 1-14) to when they play a deeper line (games 15-23). Chelsea’s average percent possession per game has fallen from 58.9 percent to 55.1 percent since they have adopted the deeper defensive line. This makes sense given that when you play a deep defensive line there is less emphasis on quickly winning the ball back and therefore the opposition has more time in possession. Related, Chelsea's net passing has declined markedly. Chelsea has completed on average about 91 more passes than opposing teams since switching to the deep line as compared to averaging about 152 more passes than opponents when playing with a higher line. Chelsea’s goals per game has fallen dramatically from 2.2 goals per game to 1.1 goals per game since adopting the deeper line. Perhaps this can be explained by the fact that with a deeper line Chelsea have spent less time in possession and have not been proficient in their counter-attacks. Defensively, Chelsea have allowed fewer goals per game with the high line, conceding 1.2 goals per game with the high line and 1.0 with a deeper line. It’s possible that this is due to the types of chances the opposition creates when a team plays a high line. With a high line you expect the opposition to create more one-on-one chances with the goalkeeper where the likelihood of scoring is high. By contrast with a deeper line the opposition has more possession and therefore may take more shots but those shots are often more speculative ones from range. Indeed, since switching to the deeper line Chelsea have conceded more shots on target per game but fewer of those shots on target result in goals. With the high line Chelsea's opponents scored a goal every 2.9 shots they had on goal. With the deeper line their opponents score a goal every 4.2 shots on goal. Finally, and most importantly, Chelsea’s points per game have fallen from 2.0 PPG to 1.6 PPG since enacting the high line. Perhaps it is time for Chelsea to return to rolling the dice and playing the high line.
Thursday, February 2, 2012
Interpreting the net passing statistic
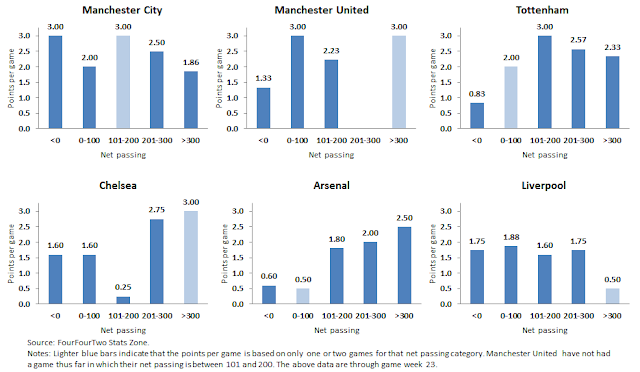
I use a statistic that I refer to as "net passing" quite often in my analysis on this blog. Net passing is simply the number of passes completed by a team net of the number of passes completed by their opponent. The purpose of such a statistic is to provide a simple description of one aspect of the game: passing. Depending on a team's style of play and tactical approach, net passing may or may not be predictive of actual match outcomes. For example, some teams depend on possession and passing to break down an opposing team's defense. On the other hand, some teams play deeper and generate scoring opportunities on the counter attack. Playing on the counter attack requires much fewer passes, and consequently, net passing is probably not very predictive of performance for these teams. The figures below show the average points per game for each of the big six clubs by the level of net passing (as of game week 23).

(Click on figures to enlarge)
The light blue bars in the figures above indicate that the points per game statistic is based on only one or two games. As a result of such a small sample, these statistics are not very reliable. Manchester City have a high points per game irrespective of their net passing. Somewhat surprisingly, they have not dropped any points in games in which their opponents have out-passed them, and they have collected the fewest points per game from games in which they completed at least 301 more passes than opposing teams. Manchester United have collected on average only 1.33 points per game from those in which they were out-passed, while they have been markedly more effective in games in which they have a positive value for net passing. Remarkably, they have out-passed opponents by a margin greater than 200 passes on only two occasions. Tottenham also have a much higher points per game when they out-pass opponents, and the pattern appears more pronounced than that of Manchester United. Chelsea have averaged a respectable 1.6 points per game in games in which they were out-passed or completed 100 or fewer passes more than opposing teams. The incredibly low 0.25 points per game for the net passing category of 101-200 serves as an important reminder that statistics can yield strange results, especially when estimated from small sample sizes. Net passing seems to be quite predictive of Arsenal's performance, which is perhaps not surprising given Arsenal's style of play. Finally, there is little variation in points per game across net passing levels for Liverpool (ignoring the >300 category, which is based on only two games).
Evaluating recent team form in the English Premier League

We often hear from soccer pundits that Premier League titles and Champions League positions are won in the winter months when top sides grind out ugly results on pitches badly worn from harsh winter weather. Mathematically, of course, every game is worth 3 points and early fixtures therefore have as much influence on who wins a title as mid season ones. However, I understand the sentiment of these pundits; what they are really saying is Premier League titles are won through consistent results throughout the season. With games coming thick and fast during the mid season fixture list, teams often experience a dip in form due to injuries and players needing rests. Typically it is the teams that are able to avoid a dip in form during the winter months that emerge as title winners and Champions League qualifiers (perhaps it would be more accurate to say titles are lost in the winter months).
The table above ranks teams according to form in their last ten league games going back to early December in order to examine which sides have remained consistent or improved on their early season form and which have experienced a dip in form. Form is defined as points per game. Manchester United top this table with 2.4 points per game from their last 10 fixtures. They have proved to be consistent in their results throughout the season with a difference of only 0.09 between points per game in their last 10 games and their first 13. Though Manchester City sit second on this table with 1.9 points per game from their last 10, they have shown the greatest dip in form from their first 13 games gaining 0.79 fewer points per game than they had early in the season. Many questioned early this season whether City would be able to cope with the marathon Premier League season and be consistent enough to win the title. The table above suggests that they cannot and that we may see United lifting the trophy yet again come early May.
Sunderland's revival under Martin O'Neill is evidenced in the table. The Black Cats have had the biggest improvement in form of all 20 clubs collecting 1.9 points per game in their last 10 compared to just 0.85 in their first 13. Interestingly, the four sides competing for the fourth Champions League spot, Chelsea, Liverpool, Arsenal and Newcastle, have all experienced a dip in form in the last 10 games. None seem interested in taking advantage of points dropped by the other three.
Wednesday, February 1, 2012
A comparison of Arsenal's 2010-2011 BPL season with the current season
Arsenal had a perfectly fine 2010-2011 season, but it was certainly nothing more. Based on a small set of performance metrics, Arsenal's performance, unsurprisingly, has declined since last year's quite average season.


Arsenal have collected on average 1.61 points per game in the Premier League compared to 1.79 last season. While 0.18 points per game might not seem like a large difference, it equates to almost a 7 point difference in a 38 game season. Furthermore, with Manchester United, City, and Tottenham, at the top of the league, Arsenal are vying with Chelsea, Liverpool, and Newcastle to secure a much coveted finish in the top 4 in order to qualify for the Champions League. Compared to last season, Arsenal have scored fewer goals and conceded more goals per game, which has resulted in a per game goal difference of 0.26 this season in comparison to 0.76 last season. Finally, Arsenal are not out-passing opponents as much as they did last season. On average, Arsenal have completed about 154 more passes than their opponent this season, while they completed about 188 more passes on average last season. In fact, opposing teams have completed more passes than Arsenal in 6 of the 23 games played (26.1 percent). In all 38 games last season, opponents were able to out-pass Arsenal on only 3 occasions (7.9 percent).
Quick reflection on Donovan's Everton contribution thus far
Landon Donovan's excellent form for Everton continued in last night's 1-0 win over league leaders Manchester City where the on loan American assisted Darron Gibson's second half winner. In Everton's 7 games with Donovan in the lineup, they have scored 9 goals for an average of 1.29 gpg. While this is hardly an overwhelming goal scoring total, Everton had netted just 6 in their 7 games prior to Donovan's arrival. Donovan has assisted 5 of those 9 goals (2 in the league, 3 in the FA Cup). Everton have a 4 wins, 2 draws, and a single defeat in Donovan's 7 games.
Subscribe to:
Posts (Atom)